
 I’m in Business Development, or “Biz Dev” for short. It’s sometimes a difficult role to describe when people ask! I’ll take a stab at an answer…
My job is to figure out and execute ways to improve the overall performance of a particular product or service. It’s not just about selling. Selling a product or service is an entirely different skill. I’m more of a facilitator. I’m interested in setting the stage to achieve incremental growth. It’s important that the sales team has a clear and simple understanding of what we are selling and what makes that product or service great. Additionally, helping a customer realize why a product or service is different and valuable in a competitive market and how it can solve their problems is key to the role.
 Finally, I want to be a champion for the vendor and help spread their message to the target audience. Data analysis is a critical tool that I must employ to achieve these objectives.
Now you may not be a Business Development Manager by title, but I promise you, if you work in a business, you are practicing Business Development on some level every day.
I love spreadsheets. One of my favorite things to do in my professional world is to sit down with a huge spreadsheet of random data, organize it, cut it up, isolate it, and find new, actionable pieces of information that I had no idea existed. You need some basic skills with spreadsheets and computing, but the real trick is asking your data the right questions. The program does all the heavy lifting, while I’m left with new insights that lead to more sound decisions.
 Armed with a few basic tools, I’m able to summarize trends and figures that answer questions like, “How can I be more profitable?” “What can I do to grow my revenue?” “Can I be more efficient by cutting out certain activities that don’t produce adequate results?” “Where should I focus my time for the greatest return?” And, perhaps most importantly, “what’s working and what’s not?”
For this discussion, I’ve picked one of the most basic goals of all to showcase some examples of how I might use data analysis to formulate a plan to achieve it.
Goal: Increase Sales
To achieve any goal, we need to develop a strategy.
Start with collecting the data. To find out where we’re going, we need to first see where we’ve been! Let’s run a report of all sales for a given period (say the last 12 months). Got it? Great. Next step…
 Organize the data. What data are we interested in evaluating? Let’s look at customer name, location, revenue, profit, products sold, date (month). Next step…
Isolate the data. This is where we start getting creative. Let’s make a pivot table. This will allow us to pair up, parse out, and split our “big data” into “little data” (example: breaking down total annual sales revenue into monthly sales revenue).
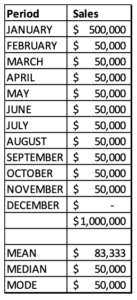
Analyze the data. Our “big data” showed that we sold (revenue) $1,000,000 of product line X in the previous 12 months. That’s an average of $83,333 per month. However, our “little data” shows that we sold $500,000 in January and $0 in December. So, while our average (mean) sales were $83,333 per month, our median (middle number) and mode (most frequent number) were only $50,000 per month. With that in mind, our average sales don’t reflect our reality.
Draw conclusion. If we want to grow our sales next year, we need to sell more than $83,333 every month. As of now, we usually (mode) sell $50,000 every month. Therefore, we need to sell around an additional $33,333 most months to ensure that we grow our sales in the next 12 months.
Define strategy. To increase our sales, we can either sell-more-to current customers OR sell-to-more new customers. Let’s assume the market is flat and our salespeople are doing a great job servicing their existing customers. That means we need to sell-to-more new customers.
Thus, our strategy is defined, to increase sales, we must find new customers.
Select Tactics. This is the fun part. Here are some examples of tactics to find new customers:
- More Data Analysis – Going back to our report, what regions are the strongest and, conversely, where do we have opportunities to grow market share? Let’s focus on those weaker regions.
- Prospecting
- Outbound call campaigns

- Tradeshows
- Referrals
- Outbound call campaigns
- Marketing
- Advertising
- Email campaigns
- Social media content
- Increasing capacity
- Hiring additional sales personnel
- Upgrading CRM
- Outsourcing
After some discussion with the team, the desired tactics are narrowed down. It is decided that while adding salespeople would be preferred, it isn’t in the budget. So, our existing sales team will commit to setting aside time to call 10 prospects every week in underserved regions, and a sales contest is added to encourage activity. Additionally, there is enough budget in Sales to upgrade the existing CRM that will add a new tool that manages and tracks call campaigns, so the company elects to invest in that upgrade to support the sales team. And finally, Marketing has some budget available, and improving the company’s presence on social media will offer benefits beyond just sales, so a job post will be put online for a new Social Media Manager.
This is a very basic example, but it illustrates how an entire strategic initiative can be born out of analyzing data. I’ve included some links below to help you, and in the next edition, I will go into the art and skill of prospecting for new opportunities.

About the Author
Tom Keefe | CTS, DMC-D-4K, DSCE
Business Development Manager – Brand Specialist
Supported Manufacturers: Absen