Data Analytics
I seriously considered pursuing culinary as a profession in my early twenties. Instead, I ended up going to school for business and working in AV. You see the connection, right? Anyways, one of the terms that you’ll hear used with frequency in a professional kitchen is “mise en place.” This is roughly translated to, “everything in place.” In practice, it means that all the ingredients and tools needed for that day’s service are prepared and organized in advance. The last thing the cooks need to be doing in the middle of firing orders is running around looking for ingredients and prepping them.
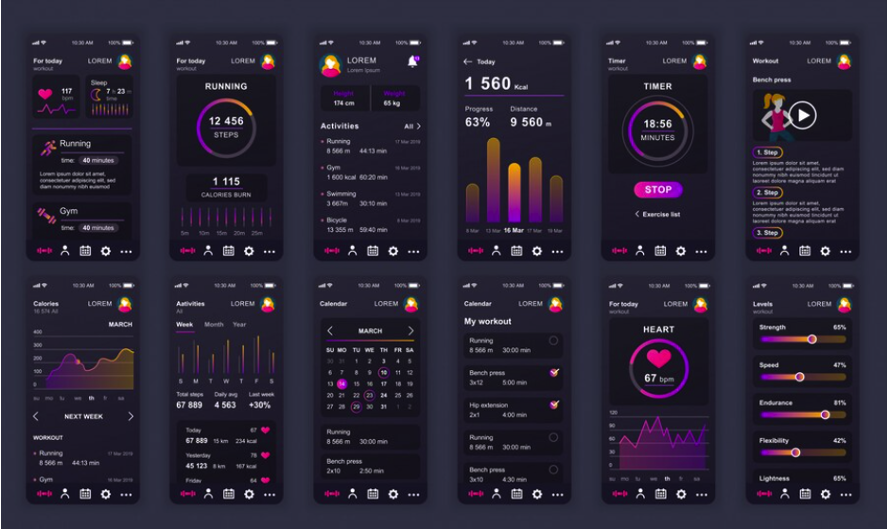
I’m an avid user of a certain fitness app that tracks my daily steps, exercise, meals, calories, weight, etc. It allows me to set goals, track my progress and evaluate my results. Even more, it uses my data to adjust my targets to optimize my health and fitness. It’s intelligent!!! This is all done through my phone on an app and I can access it anywhere, anytime, in an easily digestible format. It has helped me immensely in improving my fitness level and it keeps me motivated and focused on my goals because using it has become a habit.
Data Dashboards
Business Intelligence (BI) tools are like the Swiss Army knives of the data world; they come with all sorts of gadgets and gizmos to slice, dice, and serve up data in digestible chunks. Imagine you’re a chef, but instead of a kitchen, you have a dashboard full of KPIs (Key Performance Indicators). These tools are your sous-chefs, helping you keep an eye on the business roast, making sure it’s cooking at the right temperature, and not burning to a crisp.
Now, tracking KPIs is like having a fitness tracker for your business. It tells you how many ‘steps’ your company has taken, how ‘fit’ your sales team is, and whether your marketing ‘diet’ is working. And just like a fitness tracker, you want a BI tool that doesn’t quit on you mid-jog. That’s where the top contenders come in, flexing their features like bodybuilders at a data gym.
There are many options to consider, like Datapad, Geckoboard, Grow and—of course—Salesforce. Each has their own particular area of focus and strength. Some are more visual, while others are more focused on raw data analysis. It all depends on your unique needs.
I personally use Microsoft Power BI to track most of my KPI’s. As a category manager for DVLED, I can see things like sales or volume by customer, product, vendor or date range, and mix and match any or all of them to get real-time feedback on how the business is doing across the category. It is constantly running in the background, and I can access it in a matter of seconds at any time for quick, actionable insights. Ten years ago, I would’ve had to run multiple reports and import them into a spreadsheet to access this type of business data. It was time consuming and extremely limited in scope and function. Today, I have all this information easily viewable on a super-cool looking dashboard interface. It has been a complete game changer and time saver.
So, whether you’re a data analyst or a business owner who still thinks Excel is cutting-edge, there’s a BI tool out there that can help you track your KPIs and benchmark your progress. It’s like having a crystal ball, but instead of vague predictions, you get clear, actionable insights. And who knows, with the right BI tool, you might just find the secret ingredient to your business success recipe. Bon Appétit, data chefs!
Want more business development advice? Check out Tom’s earlier blog, “The AV MBA: S.W.O.T. It Out“.

Tom Keefe | CTS, DMC-D-4K, DSCE
Category Manager – dvLED
Supported Manufacturers: Direct View LED